📊 6.6 Dashboard Analytics
Overview
As Sweatpals continues to grow, we're adding more ways to keep track of your community data. With our latest analytics features, insights on your community's performance are easier than ever to access.
Report Builder
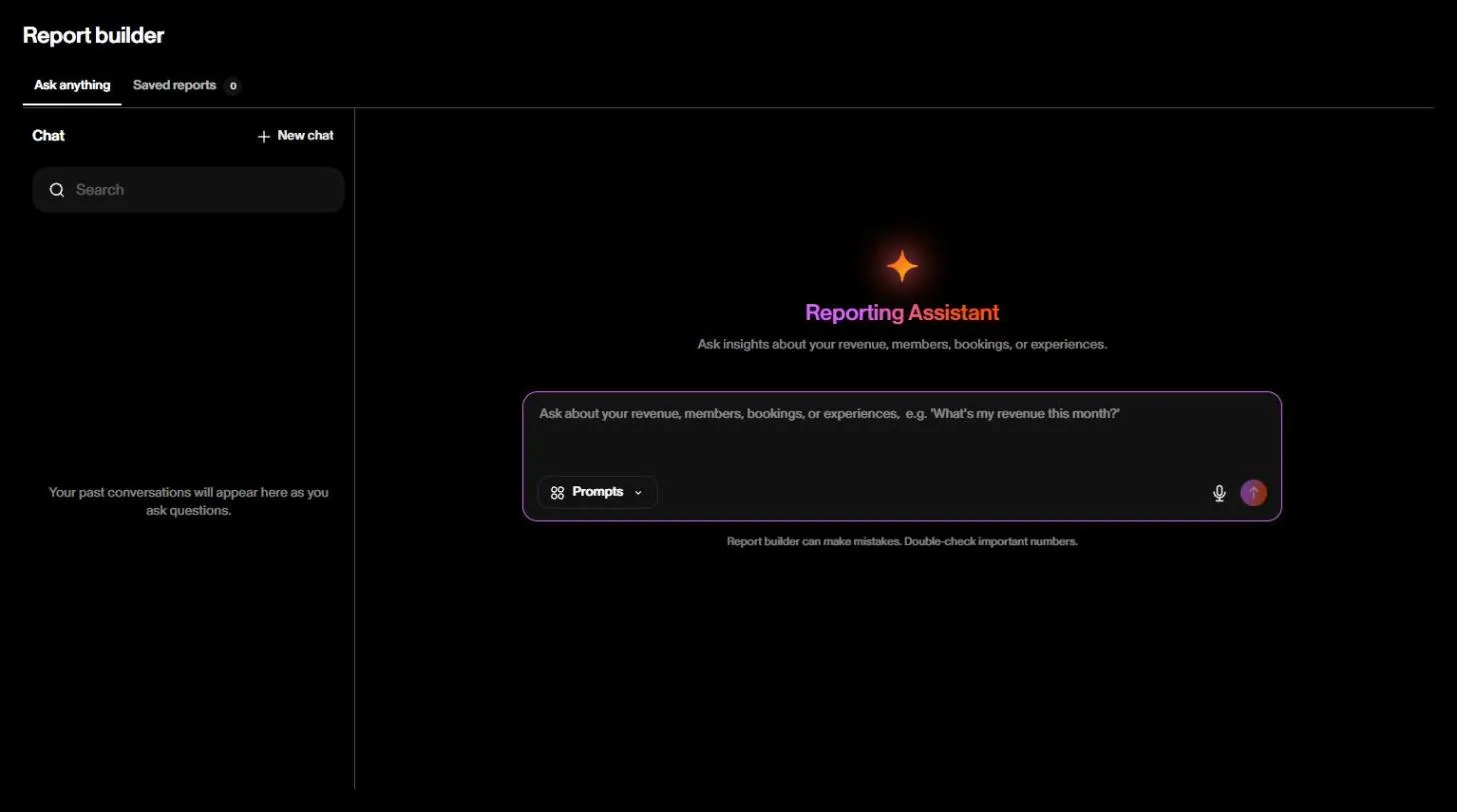
Our AI powered Report Builder works like a chat. Ask a question about your revenue, members, bookings or experiences in plain language, for example "What's my revenue this month?", and the Reporting Assistant answers with your community's data. You can ask follow-up questions in the same chat to dig deeper. To get started, open Report builder in the left sidebar of your Sweatpals web Dashboard, or use this link.
- Ask anything: start a new chat, or pick one of the suggested Prompts.
- Chat history: your past conversations are listed on the left, so you can come back to them anytime.
- Saved reports: save the reports you want to check again later.
- Export: download any report as a .CSV file.
The Report Builder can make mistakes, so double-check important numbers.
Not sure what to ask?
Ask the report builder a question the way you'd ask a teammate. Copy any of these, or use them as a starting point and swap in your own dates, classes or events.
For event organizers
Revenue
- How much revenue did I make last month?
- Which of my events brought in the most revenue this year?
- Show me my revenue by month for {year}.
- How does this quarter's revenue compare to last quarter?
Attendees and bookings
- How many people attended my events last month?
- Which event had the highest attendance this year?
- How many tickets have I sold for my upcoming events?
- Show me bookings by day of the week.
Your community
- How many new attendees came to my events this month?
- Who are my most frequent attendees?
- How many people attended more than one of my events this year?
- How many first-time attendees came back for a second event?
Planning your next event
- What day of the week gets the most bookings?
- Which time slots sell out the fastest?
- Which event types get the most repeat attendees?
For gym and studio owners
Revenue and memberships
- What was my total revenue last month, broken down by membership vs. drop-ins?
- How many active members do I have right now?
- How many new memberships were sold this month?
- Which membership plan brings in the most revenue?
- How many class packs did I sell last quarter?
Classes and attendance
- What are my most popular classes this month?
- Which classes have the lowest attendance?
- What's my average attendance per class by day of the week?
- Show me my busiest times of day.
- How many bookings did I get last week compared to the week before?
Member engagement
- Which members have booked the most classes this year?
- Which members haven't booked a class in the last 30 days?
- How many first-time visitors came back within 30 days?
- How often does the average member attend each month?
Tips for better answers
- Include a time frame. "Revenue last month" works better than "revenue."
- Be specific. "Bookings for Saturday classes in September" gets a sharper answer than "show me everything."
- Ask follow-ups. After each answer, you'll see suggested next questions you can click.
- Save the ones you use often. Click Save report on any result to find it later in the Saved reports tab.
- Share feedback with us. If an answer looks off, or there's a question you wish you could ask, let us know at [email protected]. Your feedback helps us decide what to improve next.
⚙️ This feature is currently in Beta testing. You may encounter bugs or incomplete functionality while using it. Feel free to share issues you encounter with our support team using the address [email protected]
Market & Pricing
The Market & Pricing tab (the page is called Your Prices, with Price Positions and Requirements tabs) provides a general breakdown of your attendees' spending habits as well as comparative data from your events, letting you know where they stand in comparison to other events in the same activity category and location.
To view this data, access the Market & Pricing tab in your Dashboard sidebar, or use this link.
To show Price Positions (where your prices sit compared to the market), 5 requirements must be met:
- Have at least 1 event created.
- Your events must be paid events.
- Your events must have activity categories added to them.
- Your events must have a location added to them.
- There must be at least 3 other communities hosting events in the same categories and locations as yours.
Once these requirements are met, you'll have accurate data on the market for your activity and region. The Audience Spending Profile, which shows how your attendees spend, also needs at least 50 unique attendees across your events.